The following Java Applet shows how the pipeline of the APV6 stores and processes data. The pointer yellow (top) shows the progress of the write pointer. This defines the location to which the current data are stored. The green pointer (middle) shows the progress of the trigger pointer. This defines where the data were stored at a time in the past defined by the latency (128 clock cycles in this case). The red cells (bottom) show which cells have been tagged to be read out. The blue cells (bottom) show which cells are ready to be cleared. Cells are only cleared when the trigger pointer is to the right of a pair of cells which are ready to be cleared.
The addresses which have been tagged as interesting are stored in the FIFO. Every 70 clock cycles data are read from the pipeline at the address at the top of the FIFO, and the rest of the data are moved along.
|
|
You may change the trigger rate and number of clock cycles which increment with each click by typing in the boxes. The maximum trigger rate for CMS is 100kHz, but you may set it as high as you like. At 40 MHz clock rate and 100kHz trigger rate, one in a thousand triggers will be lost due to the pipeline being full. This figure drops rapidly with decreasing trigger rate (one in 50 thousand is lost at 60kHz).
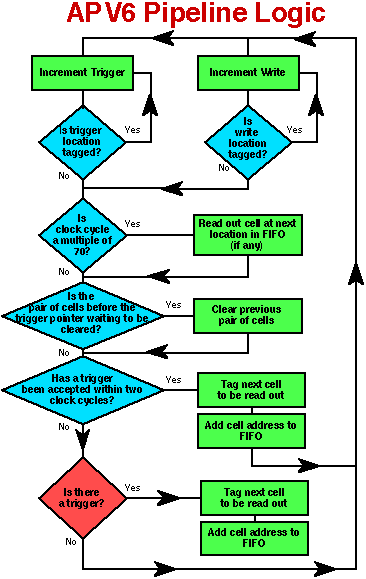
The logic of the analogue pipeline may be represented by the following flow diagram;

To save space on the chip, pipeline cells are tagged as interesting in pairs. The APV6 may operate in both peak and deconvolution mode. In peak mode, only one sample is required to be stored, so one pair of cells is tagged, but in deconvolution mode, three samples are required, to recover the timing information to tie the signal to one clock cycle, so two pairs of cells must be tagged.