<--Previous
Up
Next-->
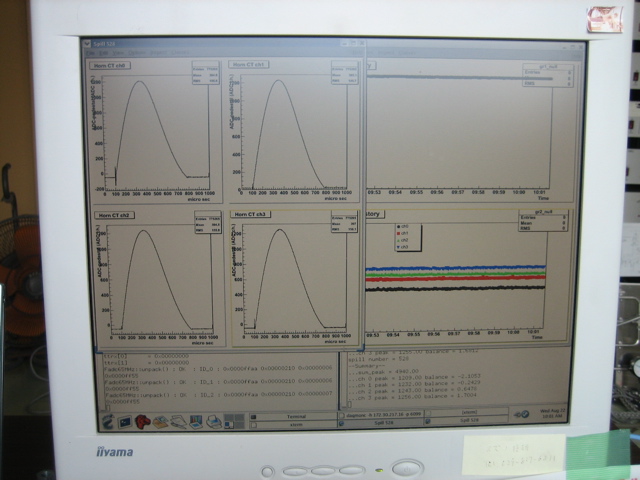
Horn test monitoring plots. Stripline current traces in upper left, and percentage deviations from expected in upper right.